Traffic fatalities up across the board in 2020, except large trucks
Despite the pandemic reducing vehicle miles traveled last year, preliminary data shows that total traffic fatalities were up in 2020, but those involving large trucks were down.
The National Highway Traffic Safety Administration has released its Early Estimate of Motor Vehicle Traffic Fatalities in 2020 report, which reveals more people were killed in crashes last year than in 2019. In fact, the projected fatality rate would be the highest in 14 years.
According to the report, an estimated 38,680 people were killed in crashes last year, up from 36,096 in 2019, a 7.2% increase. However vehicle miles traveled in 2020 plummeted by more than 430 billion miles, a 13.2% decline. Typically, there is a positive correlation with vehicle miles traveled and traffic fatalities.
Adjusted to 100 million vehicle miles traveled, the traffic fatality rate last year was 1.37, up from 2019’s 1.11 rate. That would be the highest rate since 2006 when there were 1.42 fatalities per 100 million vehicle miles traveled. Although there was a relatively slight uptick in the first quarter of 2020 (1.12), the fatality rate in the remaining three quarters skyrocketed between 1.40 and 1.46 deaths. The rate in the third quarter is estimated to be 1.49, the highest in that quarter since 2005 (1.54).
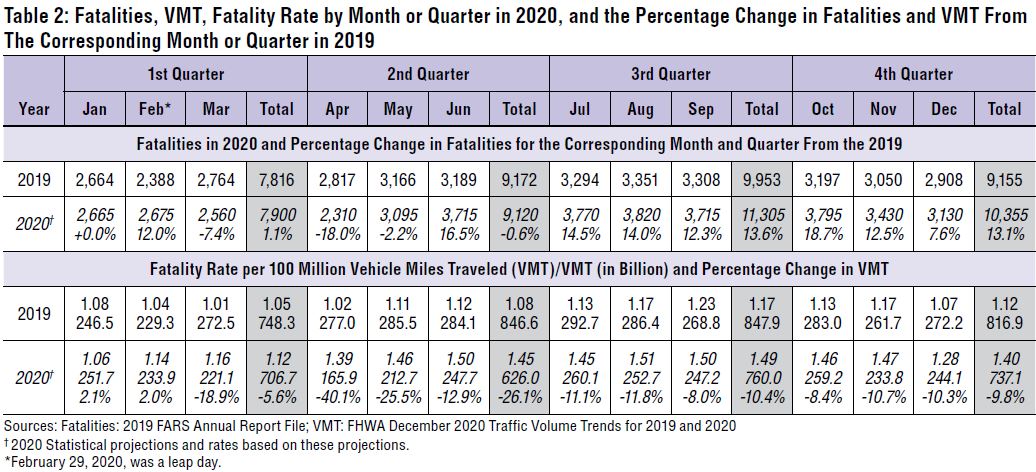
Broken down by month, traffic fatalities correlate with stay-at-home orders during the pandemic, which began in March.
Since the nation was quarantined for only part of March, there were actually fewer deaths compared to March 2019. April, the first full month of stay-at-home orders, shows a similar trend with an 18% decrease in fatalities – the highest decrease by month in 2020 – and a 40% decrease in vehicle miles traveled, the largest decrease in that category by month.
However, as states began to reopen around May, traffic fatalities began to dramatically increase. June saw a traffic death increase of 16.5% and 13% decrease in vehicle miles traveled. That trend would continue throughout the rest of year, with number of deaths by month increases ranging from 7.6% in December and 18.7% in October.
All 10 NHTSA regions experienced an increase in traffic fatalities. Region 2 (Connecticut, New Jersey, New York and Pennsylvania) suffered the highest increase at 10%. Conversely, Region 10 (Alaska, Idaho, Montana, Oregon and Washington state) saw a low increase of 1%.
Most major categories saw an increase in traffic fatalities in 2020. Motorcyclist deaths increased by 9%, followed by passenger vehicle occupant and pedalcyclist deaths each up by 5%. Pedestrian deaths remained mostly unchanged.
While the vast majority of categories and subcategories saw some sort of increase in traffic deaths last year, one category experienced a decrease: crashes involving a large truck.
In 2020, there were an estimated 2% decrease in fatalities in those crashes. Another decrease were fatalities among those 65 and older (minus 9%).
By subcategory, the following experienced significant increases in traffic fatalities last year:
- Non-Hispanic Black people (up 23%)
- Occupant ejection (20%)
- Unrestrained occupants of passenger vehicles (15%)
- On urban interstates (15%)
- On urban local/collector roads (12%)
- Speeding-related crashes (11%)
- On rural local/collector roads (11%)
- During nighttime (11%)
- During the weekend (9%)
- Rollover crashes (9%)
- Single-vehicle crashes (9%)
- Police-reported alcohol involvement crashes (9%)
“NHTSA’s research suggests that throughout the national public health emergency and associated lockdowns, driving patterns and behaviors changed significantly, and that drivers who remained on the roads engaged in more risky behavior, including speeding, failing to wear seat belts, and driving under the influence of drugs or alcohol,” the report states. “Traffic data indicates that average speeds increased throughout the year, and examples of extreme speeds became more common, while the evidence also shows that fewer people involved in crashes used their seat belts.”
Fatality counts for 2019 and 2020 will be further revised. The final file for 2019 and the annual reporting file for 2020 will be available later this year. These estimates may be further refined when the projections for the first quarter of 2021 are released in late spring of 2021. LL
Related News