FHWA report reveals urban congestion has not improved
Time spent in traffic in urban areas has not improved much, according to the Federal Highway Administration’s Urban Congestion Trends report.
On Tuesday, Oct. 8, FHWA released its 2018 Urban Congestion Trends report. The report rates congestion in the 52 largest metro areas in three categories: hours of congestion, travel time index and planning time index.
Hours of congestion is defined as the amount of time when freeways operate less than 90% of free-flow freeway speeds. According to the report, the national average dropped by one minute from 4 hours and 17 minutes to 4 hours and 16 minutes.
The travel time index is the time penalty for a trip on an average day. For example, a travel time index of 1.30 indicates a 20-minute free-flow trip takes 26 minutes (20 × 1.30) during rush hours. Nationwide, that number remained stagnant at 1.33, or 26.6 minutes.
A planning time index is a time penalty for a trip to be on time for 95% of trips. Think of it as travel time on the worst day each month. An index of 1.60 indicates a 20-minute free-flow trip takes more than 32 minutes (20 × 1.60) one day per month. In this category, the nationwide average improved from 2.15 (43 minutes) to 2.13 (42.6 minutes).
Although there were no increases at the national level, the decreases were small. A difference of a minute or two is hardly noticeable. In fact, several metro areas saw large increases of congestion.
Only eight of the 52 cities studied improved in all three categories. Conversely, 20 metro areas worsened in all three categories. Just slightly more than half of the areas reported improvements in travel time index and planning time index.
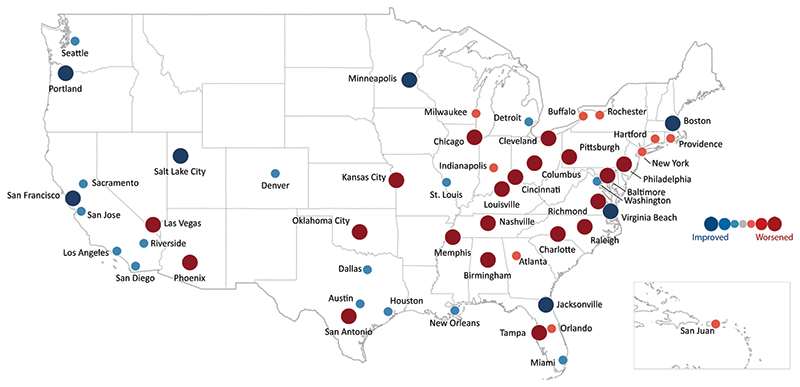
As the above map shows, more cities saw large increases in congestion compared with cities that experienced improved congestion.
Methods to improve congestion
The report also highlights some ways cities have mitigated congestion.
Georgia implemented automated traffic signal performance measures. Measurements from signals that were once compiled manually are now collected through automation.
Delaware was experiencing problems at the interchange of SR 1 and SR 72. The Delaware Department of Transportation installed what is called a diverging diamond interchange, which allowed free-flowing left turns.

In Washington, D.C., people searching for a parking space in the Penn Quarter/Chinatown area was a major source of congestion. The District Department of Transportation’s solution was to devise an app that included real-time parking availability and pricing.
There are many external factors that lead to congestion as well. Much like traffic fatalities, congestion can move up or down depending on the state of the economy. When the country is in a recession, fewer people are driving to work or driving leisurely. Consequently, when the economy is booming, more people are on the roads.
Fuel prices can also play a role in congestion for similar reasons. When prices are high, those on a tight budget will limit their driving. However, when fuel prices are relatively low, more people are driving and for longer distances.
Related News