Spot rates rise as shippers shop for capacity ahead of July 4 holiday
Spot van and reefer rates gained steam last week as jurisdictions ease shopping restrictions and retailers look to move goods ahead of the Fourth of July holiday.
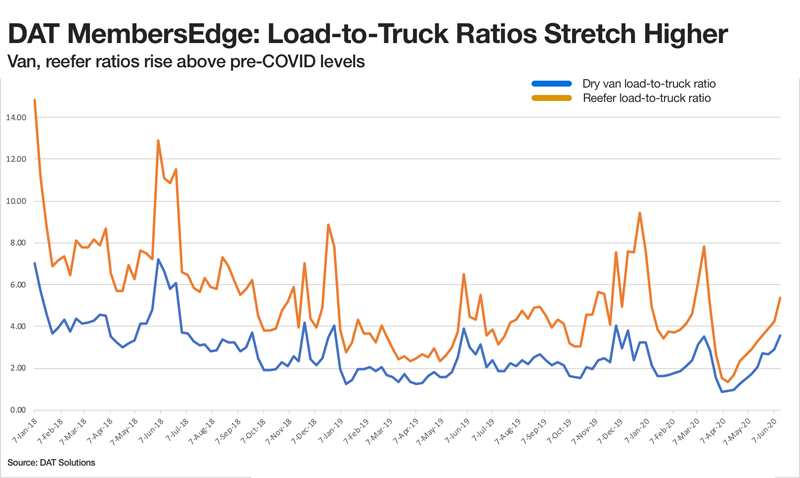
The number of available loads last week on DAT MembersEdge increased 15.6% compared to the previous week and national average van and reefer line-haul rates were higher than where they were before the coronavirus crisis began in February.
A 3.5% decrease in the number of posted trucks last week also helped elevate rates.
National monthly average spot rates through June 22
Van: $1.76 per mile, 16 cents higher than the May average.
Flatbed: $2.04 per mile, 14 cents higher than May.
Reefer: $2.11 per mile, 9 cents higher than May.
Those are rolling averages for the month and current spot rates are trending upward. On June 1, the van spot rate averaged $1.72 a mile, the flatbed rate was $1.98, and the reefer rate was $2.08.
Trends to watch
Vans are on pace with 2019
Van load posts and rates last week were now tracking closely with 2019 levels. At 3.6 loads per truck, the national average van load-to-truck ratio is actually higher than the June 2019 average, and average rates fell on just 11 of DAT’s top 100 van lanes by volume last week.
Retail hubs are busy
Volumes and rates were increasing out of retail hubs like Memphis last week. Compared to the previous week, spot van prices rose on several key outbound lanes:
- Memphis to Atlanta increased 16 cents to an average of $2.40 per mile.
- Memphis to Indianapolis was up 20 cents to $2.23.
- Memphis to Columbus gained 19 cents to $2.14.
It’s storm season
Among major van lanes, the biggest spot rate-drop last week was from New Orleans to Dallas, where prices had previously spiked due to Tropical Storm Cristobal. Rates were back down 15 cents to $1.68 per mile. It’s a reminder that we’re headed into storm season—watch the weather for fluctuations in rates, volumes, and traffic patterns as shippers use the spot market to position freight.
Port volumes are down
Lower volumes at major U.S. ports are affecting both the coastal dray and truckload dry van markets. The Port of Los Angeles reported close to 30% fewer containers moved in May compared to the same time last year. Imports dropped 28.4%, while exports were down 37.6%. On the opposite coast at the nation’s number-two port, Elizabeth, N.J, container volumes dropped 7.5% in May year over year.
Domestic produce is heating up
The national average reefer load-to-truck ratio jumped to 5.4 loads for every truck posted, up from 4.3 the previous week. Volumes were steady as an increase in domestic produce balanced out a reduction in imports from Mexico and Canada.
COVID cases in ag markets
New COVID-19 cases are hitting Texas, Florida, Georgia, South Carolina, Arizona, California, and other states where the weather is hot and agricultural production is in full force.
Hot markets shift north
Reefer opportunities are shifting north as fruits and vegetables come into season. According to the Northwest Cherry Growers, the Pacific Northwest cherry season expects to produce close to 20 million 20-pound boxes, which equates to around 625 truckloads per week over the 16-week season ending late August. Unless it’s a rainy summer, the Pacific Northwest should provide plenty of opportunities for carriers looking for loads out of Washington and Oregon through the end of July.
Housing starts are increasing
Total housing starts and building permits increased by 4.3% and 12% respectively in May. The freight-intensive single-family housing market is still down 18% year over year but flatbed carriers and retailers in building, construction, and landscaping have every reason to be optimistic in the short-term. A faster-than-expected turnaround in homebuyer demand resulted in the National Association of Home Builders/Wells Fargo Housing Market Index jumping 21 points to 58. That’s the largest-ever monthly increase after plunging 42 points in April.
This summary’s month-to-date national average spot rates were generated using DAT RateView, which provides real-time reports on spot market and contract rates, as well as historical rate and capacity trends. The RateView database is comprised of more than $68 billion in freight payments. Actual spot rates are negotiated between the carrier and the broker.
For the latest spot market updates related to COVID-19, visit DAT.com/industry-trends/covid-19 and follow @LoadBoards on Twitter. You can post comments on the DAT Freight Talk blog or on the DAT Facebook page. You can listen to the DAT MembersEdge report every Wednesday on Land Line Now.
Here is a June 10 report from DAT Solutions.
Related News