Capacity swings to the contract freight market as spot rates soften
Declining spot rates and load availability at this time of year shouldn’t surprise anyone in trucking. It’s the angle of decline that has everyone’s attention.
The total number of loads posted to the DAT MembersEdge load board fell 8.5% during the week of April 10-16. Load posts dropped for all three equipment types: the number of van loads on the network was down 12% week over week; reefer loads also fell 12%; and the flatbed load count was down 6%.
Capacity edged lower, but not by much. The total number of trucks on the network slipped 0.8% last week, with van equipment posts down 0.5%, reefer trucks 2.6% lower, and flatbed equipment posts down 0.6%.
The number of loads on the network last week was almost equal to the number of loads posted during the same week in 2018, considered a boom year for spot freight, while the supply of capacity was almost equal to the same week in 2019, a “down” year.
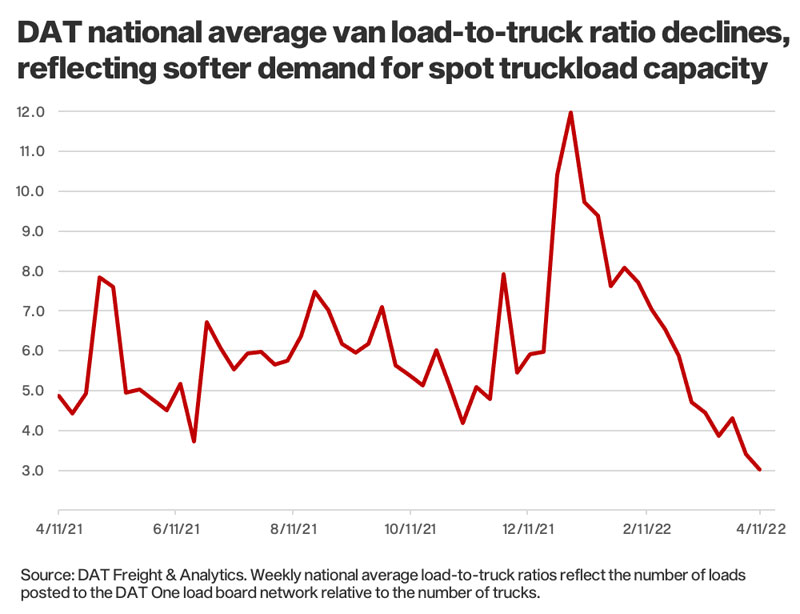
Load-to-truck ratios decline
National average load-to-truck ratios reflected lower demand for trucks:
- Van load-to-truck ratio was 3.0 as a national average, down from 3.4 the previous week.
- Reefer load-to-truck ratio was 5.9, down from 6.6.
- Flatbed load-to-truck ratio was 58.7, down from 63.0.
Rates slip further
Dry van and reefer spot rates have dropped by 20% since the start of the year. Rates fell again last week, continuing a downward trend:
- Van freight averaged $2.83 a mile last week, down 6 cents from the week before.
- Reefers averaged $3.12 a mile, down 5 cents from the previous week.
- The flatbed rate fell 3 cents to an average of $3.31 a mile. That’s the first decline in four weeks.
Spot rates are weekly broker-to-carrier rates as reported in DAT RateView. These rates are based on invoices from actual loads moved and not the “asking price” the broker posts on the load board. Prices are negotiated by the carrier and broker on a per-load basis.
Because broker-to-carrier rates on the load board typically include a calculated fuel surcharge, it’s important for carriers to know their fuel costs and negotiate to recover them when they agree to terms with a broker. Excluding fuel, weekly spot van and reefer line-haul rates are below year-ago averages:
- Van – $2.19 per mile, down 7 cents year over year.
- Reefer – $2.50 per mile, down 6 cents year over year.
The flatbed rate was $2.68 per mile excluding fuel, 13 cents higher year over year. Line-haul rates for all three equipment types are also above 2018 spot prices, when vans averaged $1.86 a mile, reefers $2.10 a mile, and flatbeds $2.28 a mile.
Market of the week
Despite a gloomy outlook due to water shortages, farmers are increasing demand for reefer trucks in Fresno, a large geographic area in Central California that produces a range of crops and livestock. Currently in harvest are broccoli, carrots, leafy greens, peas and blueberries. The average outbound reefer spot rate last week from Fresno increased 5 cents to $2.92 per mile after falling for three consecutive weeks. Key lanes:
- Fresno to Boston – $2.81 per mile, up 13 cents week over week. Rates on this lane trend upwards through July.
- Fresno to Hunts Point, N.Y. – $2.75 per mile, up 13 cents.
- Fresno to Seattle – $4.11 a mile, virtually unchanged.
Land Line Now
Tune in to Land Line Now each Wednesday for the latest market analysis from DAT industry analyst Dean Croke, or visit DAT.com/blog/category/market-update.
DAT MembersEdge is a service provided exclusively to OOIDA members at a discounted price. LL
Related News