Spot van rates, volumes continue monthlong slide
The number of available loads on DAT MembersEdge continued to slide last week and the national average spot van and reefer rates are now lower than their corresponding contract rates.
The difference between spot and contract van rates was as high as 14 cents a mile in September; for reefer freight, the gap hit 20 cents a mile in November around Thanksgiving.
It’s a sign that contract rates are up and the seasonal softening of spot rates has settled in. The question going forward is how much further spot rates will continue to fall. Given the lofty rate peaks at the end of 2020, we could see a substantial correction.
National average rates, January
- Van: $2.40 per mile, 6 cents lower than the December average.
- Flatbed: $2.48 per mile, 1 cent higher than December.
- Refrigerated: $2.64 per mile, 4 cents lower than December.
These are national average spot rates for the month through Jan. 24. These averages are based on actual transactions negotiated between the carrier and broker or shipper.
Trends
Fuel prices keep climbing: The average price of on-highway diesel was $2.37 per gallon to start November, the low point for the year; last week, the price averaged nearly $2.71 a gallon.
Van volume dips
Dry van load-post volume fell 12% compared to the previous week as seasonality started to set in. Less than 1% more trucks were posted, pushing the van load-to-truck ratio down from 3.6 to 3.2.
While the number of loads moved on DAT’s top 100 van lanes by volume declined by 0.7% last week compared to the previous week, the average spot truckload rate fell on 93 of those 100 lanes. The rate increased on just one lane and was neutral on six.
On DAT’s top 10 markets, dry van load post volumes dropped by 10% last week; spot rates fell an average of 11 cents a mile in these markets.
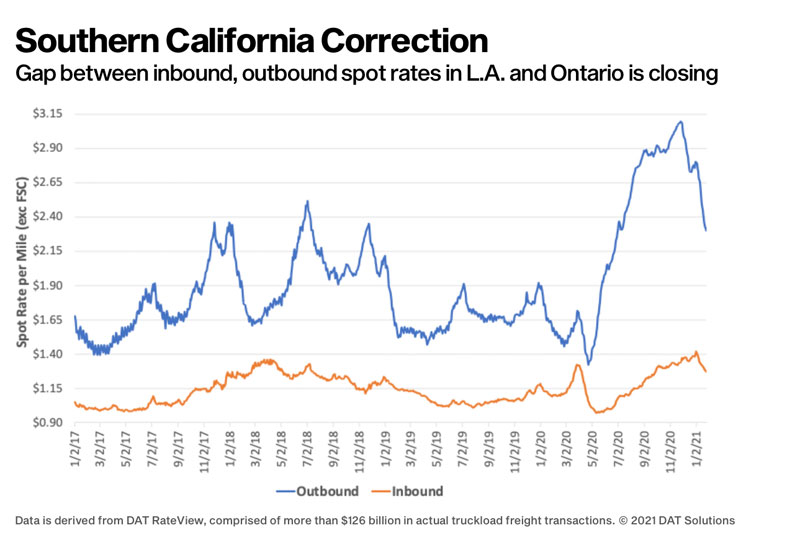
California correction
We’re seeing a major correction underway as freight volumes in Southern California markets return to pre-pandemic levels. Los Angeles averaged $2.80 a mile last week, down 18 cents compared to the previous week and 31 cents lower since the first week of the year. Key lanes:
- Los Angeles to Chicago: $2.23 a mile, down 48 cents since the beginning of January.
- Los Angeles to Dallas: $2.50 a mile, down 43 cents.
- Los Angeles to Atlanta: $2.31 a mile, down 48 cents.
At the start of November, the separation between inbound and outbound rates in Los Angeles and Ontario, Calif., market was as great as we’ve ever seen. The spread is still almost a dollar mile but it is closing, an indication that perhaps we’ve all made the bulk of our one-off, pandemic-inspired purchases of imported goods.
Reefers slow
Nationally, the average reefer load-to-truck ratio dropped from 6.5 to 5.9 last week as the number of load posts fell 11% with very little change in truck posts. The number of loads moved on DAT’s top 72 reefer lanes by volume increased 10% week over week, although the average rate was lower on 67 of those lanes. Load post volumes dropped in most of the top 10 markets, however.
Domestic produce shipment fall
According to the U.S. Dept. of Agriculture, domestic truckloads of produce were down 37% year over year for the week ending Jan. 16, but up 13% year over year for imported truckloads. The decrease in domestic volumes is significant and driven by persistent, devastating conditions in the foodservice business. At $659 billion, restaurant and foodservice industry sales were 27% below expectations and more than 110,000 eating and drinking places closed for business temporarily, or for good, in 2020, according to the National Restaurant Association.
Florida volumes pick up
In Florida, winter produce volumes are providing backhaul opportunities for carriers that ventured into the Miami and Lakeland markets, where volumes increased by 19% and 23%, respectively, compared to the previous week. Higher volumes and outbound rates from Savannah, Ga.; Jacksonville, Fla.; and Tifton, Ga., were incentives for carriers to stay in southern Georgia, keeping capacity tighter for outbound Florida loads.
National average rates are derived from DAT RateView, a database of $126 billion in actual market transactions each year. These rates are averages from last week and this week will be different. Look at the rates and load-to-truck ratios in MembersEdge to understand which way the rates are trending and negotiate the best deal you can get on every haul.
You can get all of the latest spot rate information at DAT.com/Trendlines. Or take a deeper dive with Market Insights at DAT.com/blog.
Stay safe, and thank you for your hard work. LL
Listen to this Land Line Now podcast, “2020 wasn’t so bad for trucking economics.”
Here’s DAT’s Land Line report from two weeks ago.
Related News