Spot rates stay unseasonably warm, DAT reports
Spot rates on DAT MembersEdge continued to buck the trends for late July as shippers and freight brokers look to the spot market for to help them work through supply chain imbalances.
The number of van, reefer, and flatbed loads on the MembersEdge fell 3% during the week ending July 26 while the number of trucks posted increased 2%.
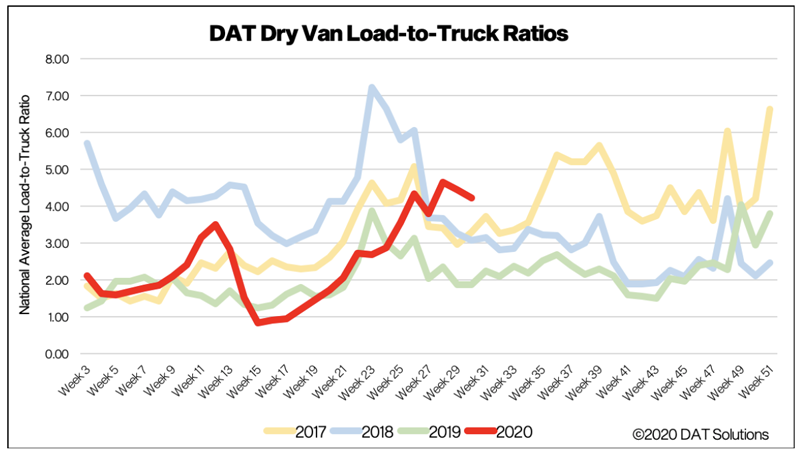
Yet national average rates for all three equipment types were tracking well ahead of seasonal expectations through last week. The national average line-haul van rate (excluding fuel surcharges) hit $1.88 per mile last week, equal to the same week in 2018 when capacity was considerably tighter. The number of load posts was roughly 30% higher year over year.
National average spot rates, July
- Van: $2.03 per mile, up 22 cents compared to June.
- Flatbed: $2.19 per mile, up 12 cents.
- Reefer: $2.29 per mile, up 14 cents.
These rates are rolling averages for the month through July 26. They include a fuel surcharge.
National average month-to-date line-haul rates (excluding fuel) last week increased 1 cent for vans and flatbeds at $1.83 and $1.95 per mile, respectively, compared to the previous week. The average spot reefer line-haul rate was unchanged at $2.07.
Trends to watch
Retail lanes are busy
Average spot van rates last week were higher on 50 of DAT’s top 100 lanes by volume compared to the previous week and pricing increased on several key lanes:
- Memphis, Tenn., to Atlanta: $3.01 per mile, up 45 cents.
- Houston to Oklahoma City, Okla.: $2.55 per mile, up 19 cents.
- Stockton, Calif., to Salt Lake City: $3.16 per mile, up 12 cents.
Average rates moved higher in larger retail freight hubs including Ontario, Calif., a bellwether for truckload activity given its proximity to the ports in Los Angeles. Following a surge in imports in June, spot van loads out of Ontario were up 4% week over week and increased for the fourth week in a row as freight comes inland to warehouse hubs like Phoenix, Dallas, and Stockton.
Produce volumes fall
The latest U.S. Dept. of Agriculture produce shipment report shows that seasonal year-over- year volumes of produce are down 6% for domestic and 26% for imported truckload shipments, which is just over 6,200 fewer loads of produce compared to the same week in 2019.
A shortage of trucks was reported for melons from Maryland, Delaware and Virginia, southwest Indiana, southeast Illinois, North and South Carolina, and Missouri. A slight shortage of trucks was reported for onions from southern New Mexico; watermelons and onions from the Lower Rio Grande Valley in New Mexico; watermelons and onions from the Lower Rio Grande Valley in Texas; and limes, mangos, tomatoes, broccoli, mixed fruits, and vegetables from Mexico border crossings in Texas.
Nationally, after remaining flat for the previous four weeks, the reefer LTR dropped last week by 8% to seven loads per truck, which is up 50% compared to last year.
But imports arrive in the East
Volumes increased on half of DAT One’s top 72 reefer lanes last week. East coast import markets, including Philadelphia and Elizabeth, N.J., were up a combined 6% week over week and 29% month over month as produce from the Southern Hemisphere arrives by sea. Harrisburg, Pa.; Atlanta; Boston; Lakeland, Fla.; and Miami were the top five destinations for reefer freight from Philadelphia and Elizabeth last week, and reefer spot rates out of both markets were strongest in the 300-mile length of haul range.
DIY and home construction boost flatbed volume
Flatbed freight volumes are expected to remain high based on data from the U.S. Dept. of Commerce, which reported a 17% increase in new home construction in June. Expect ongoing demand to haul standard framing dimension softwood lumber as wholesalers and distributors look to stock depleted inventories.
Flatbed spot rates inched higher last week, increasing by just over 2 cents to $1.98 a mile, excluding fuel surcharges. Flatbed rates are now 5% higher year over year but last week’s rate is around 35 cents lower compared to the same week in 2018 when capacity was very tight.
Even though flatbed capacity is showing signs of increasing, it is much tighter than the same week in 2019 when 31% more trucks were searching for loads.
Remember, these rates represent averages from last week, and this week will be different. Negotiate the best deal you can get on every haul, and look at the rates and load-to-truck ratios in MembersEdge to understand which way the rates are trending.
For the latest spot market updates related to COVID-19, visit DAT.com/industry-trends/covid-19 and follow @LoadBoards on Twitter. You can post comments on the DAT Freight Talk blog or on the DAT Facebook page. You can listen to the DAT MembersEdge report every Wednesday on Land Line Now. If you’re a company driver, DAT has a free app called DAT Trucker. It shows where to find fuel, truck stops, weigh stations, Walmart stores, and other important locations while you’re on the road. It’s in Google Play or Apple’s App Store.
Related News