Rates on MembersEdge build to new highs, show signs of a plateau
Three weeks after winter storms upended supply chains across the country, we’re starting to see more normal freight patterns and signs that spot truckload rates have crested.
The number of loads posted on DAT MembersEdge fell 11.4% and the number of trucks increased 9.2% last week compared to the previous week. Easing capacity and more predictable travel conditions appear to have propelled spot rates to a plateau well above seasonal expectations.
National average spot rates, March
- Van: $2.70 per mile, 30 cents higher than the February average.
- Flatbed: $2.70 per mile, 14 cents higher than February.
- Refrigerated: $2.95 per mile, 26 cents higher than February.
These are national average spot truckload rates for the month through March 14. They include a calculated fuel surcharge; diesel averaged $3.07 per gallon last week, up 3.3% compared to the previous week.
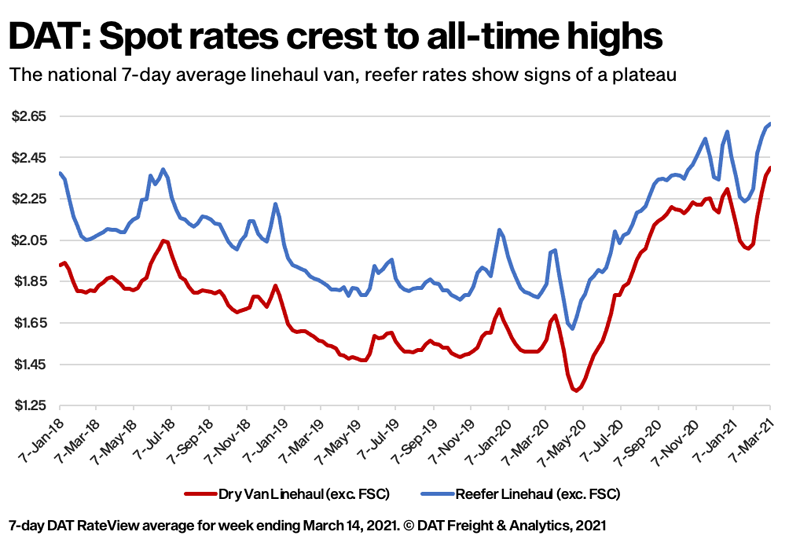
The seven-day average van and reefer line-haul rate, which excludes fuel, set all-time highs for the DAT network last week. The van line-haul rate averaged $2.40 per mile; the reefer rate was $2.61 per mile.
Trends
Flatbed demand heats up
Flatbed load post volumes have been on the rise for four weeks in a row and the national average flatbed load-to-truck ratio averaged 77.6 last week, more than 15 points above the February average.
Rates increased on 50 of DAT’s top 78 flatbed lanes by volume, while 22 lanes were neutral, and just six lanes were down. The country’s busiest lane for spot flatbed freight last week, Lakeland, Fla., to Miami, averaged $3.15 a mile and is up 11 cents over the past four weeks. As we head toward peak seasons for construction, produce and other loads, the need for drivers with the skills and qualifications to manage flatbed freight is gaining steam as well and – as always – is a huge factor in available capacity.
Flatbed market to watch
Baltimore is the top roll-on/roll-off port in the United States and handles most of the East Coast’s market share of roll-on/roll-off cargo annually.
Baltimore’s proximity to major farm and construction equipment manufacturers in the Midwest makes it a key origin point for agriculture, farming and mining machinery. According to import data from PIERS, tonnage of roll-on/roll-off equipment in February is up 301% year over year. Construction equipment represents 66% of total roll-on/roll-off volume imports through the Port of Baltimore or the equivalent of 600 truckloads in February 2021, which is about 340 more truckloads compared to February 2020. So far, things are looking good for flatbed and specialized carriers.
Van volumes level off
While the number of loads last week moved was up 2% across DAT’s top 100 lanes for van freight, overall van load post volumes fell 23% week over week. With 11% more truck posts, the van load-to-truck ratio dropped from 7.8 to 5.4. The average rate improved on 44 of DAT’s top 100 lanes, was neutral on 27 lanes and was lower on 29 lanes.
Van markets to watch
In Memphis, Tenn., volume was down 10% last week, but tight capacity helped push the average van rate up 9 cents to $3.29 a mile compared to the previous week. In Atlanta, load volume declined 13% yet the average rate increased 5 cents to $2.74 a mile. And in Los Angeles, the average outbound rate increased 2 cents to $3.32 a mile despite 27% less volume.
Reefer rates stay high
Spot reefer rates remained exceptionally high for this time of year. At $2.95 per mile, the national average rate is 75 cents higher compared to the March average in 2020. Cold weather in the upper half of the U.S. this week should keep reefers in demand as shippers add “protect from freeze” to bills of lading to prevent temperature-sensitive dry freight from freezing.
Reefer volumes slip
Reefer load post volume last week dropped by 23% week over week. With 8% more truck posts last week along with fewer load posts, the reefer load-to-truck ratio slipped from 15.6 to 11.0. The number of loads moved on DAT’s top 72 reefer lanes by volume was virtually unchanged compared to the previous week. The average rate, however, was higher on 43 of those lanes, neutral on 12, and lower on 17 lanes. Again, tight capacity is providing a toehold for spot truckload rates.
National average rates are derived from DAT RateView, a database of $110 billion in actual market transactions each year. Get the latest spot pricing information at DAT.com/Trendlines or take a deeper dive with Market Insights at DAT.com/blog.
Stay safe, and thank you for your hard work. LL
Check out the March 4, 2021, DAT report for Land Line here.
OOIDA offers a MembersEdge discount on DAT services to its members.
Related News