Load and truck posts jump after the holidays, DAT reports
Spot truckload activity during the first full week of 2021 picked up where it left off at the end of 2020, with big increases in load and truck posts as shippers worked through freight that was backlogged during the holidays.
Compared to the previous week, the number of freight postings last week increased 46% and available trucks on DAT load boards jumped 59% during the week ending Jan. 10. Load-to-truck ratios dipped and spot pricing declined slightly compared to the previous week, although national average rates are falling away from historic highs.
National average rates, January
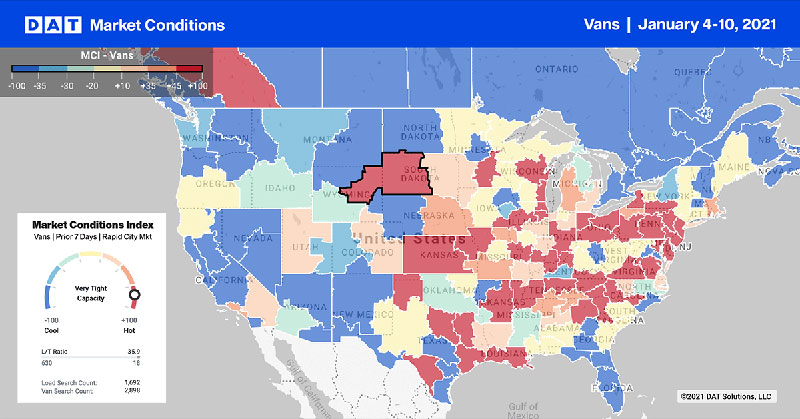
- Van: $2.53 per mile, 7 cents higher than the December average.
- Flatbed: $2.48 per mile, 1 cent higher than December.
- Refrigerated: $2.79 per mile, 11 cents higher than December.
These are national average spot rates for the month through Jan. 10. These averages are based on actual transactions negotiated between the carrier and the broker or shipper.
Trends
Port congestion cools California volumes
The number of loads moved on DAT’s top 100 van lanes by volume jumped 16% last week compared to the previous week on the strength of retail restocking and ecommerce, but rates were softer. The average spot truckload rate fell on 59 of those 100 lanes. Eighteen were neutral and rates increased on 23 lanes.
The most notable market movement last week was in Southern California. Load availability has fallen dramatically in Los Angeles and Ontario, Calif., which were the number one and two markets just a few weeks ago, and spot rates have fallen in markets up and down the West Coast:
Los Angeles: $3.13 a mile, down 14 cents on a 4% increase in volume compared to the previous week.
Stockton, Calif.: $2.63 a mile, down 4 cents on a 16% increase in volume.
Seattle: $2.05 a mile, down 6 cents on a 4.5% increase in volume.
Shippers have been diverting containerized volume to Gulf and East coast ports, which is a major reason for the 31% week-over-week spike in truckload volumes in Houston. With Houston container volumes up 28% year over year, this is a van market to watch in the coming weeks.
Winter produce markets kick in
Nationally, the average reefer freight load-to-truck ratio dropped from 15.6 to 12.3 last week as food shipments slow after post-holiday restocking. The number of loads moved on DAT’s top 72 reefer lanes by volume fell 10.4% week over week and is down 20.4% over the last four weeks.
The average spot rate was higher on 48 of those lanes, however, compared to the previous week. The top-risers were seasonal produce lanes as harvests continue in Arizona and California and imports hit port markets in the Northeast and Mexican border:
- Tucson, Ariz., to Chicago: $3.02 a mile, up 46 cents.
- Tucson to Dallas: $3.32 a mile, up 43 cents.
- Elizabeth, N.J., to Chicago: $2.24 a mile, up 20 cents.
- McAllen, Texas, to Elizabeth: $3.57 a mile, up 28.
Even Florida, where spot rates tend to be low, offers opportunities for carriers to haul winter vegetables, tomatoes and strawberries. And with the short-haul ELD exemption increased to 150 miles, a lot of growers are taking advantage by adding multiple pickups and drops to each full load (without incurring any drive-time in the drivers log).
Flatbed demand hanging in there
The national average flatbed load-to-truck ratio declined from 52.7 to 50.3 last week, well ahead of the monthly average of 40.2 in December and 13.3 in December 2019. Pricing on DAT’s top 78 flatbed lanes was higher on 27 lanes, lower on 21 lanes, and neutral on 30 lanes. Volume on these lanes fell 7.8% compared to the previous week.
The flatbed freight market experienced a boost from better-than-expected manufacturing data, with the U.S. manufacturing index rising slightly in December. Load post volumes in the vast majority of flatbed markets were higher compared to the prior week. Memphis and Little Rock, Ark., maintained their number one and two positions for available loads.
National average rates are derived from DAT RateView, a database of $126 billion in actual market transactions each year. These rates are averages from last week and this week will be different. Look at the rates and load-to-truck ratios in MembersEdge to understand which way the rates are trending and negotiate the best deal you can get on every haul. DAT offers an OOIDA discounted rate.
For the latest spot market load availability and rate information, visit the load board or tune in to Land Line Now. The latest spot rate information is available at DAT.com/trendlines.
Stay safe, and thank you for your hard work. LL
Related News