Cross-border freight dips in April; still high overall
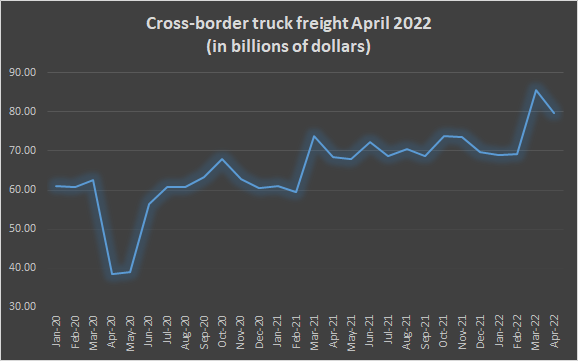
Despite a drop from March, cross-border freight hauled by trucks in April was the still the second highest on record.
According to the latest numbers from the Bureau of Transportation Statistics, trucks hauled nearly $80 billion of freight across the northern and southern borders in April. Compared to last April, cross-border truck freight is up 16.5%.
In March, the value of cross-border freight reached an all-time high. Although cross-border truck freight dipped by 7% in April, the total value is still the second highest on record.
Values of nearly all top commodities hauled by trucks fell compared to the previous month. Measuring/testing instruments shipments dropped by 12%, followed by electrical machinery equipment/parts (minus 11%) and furniture, lamps and prefabricated buildings (minus 10%). Edible fruits and nuts was the only commodity to experience an increase in cross-border truck freight (4%).
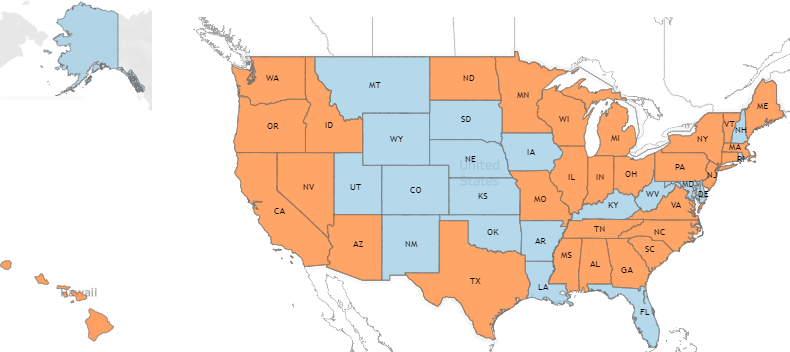
Eleven states experienced an uptick in truck freight crossing the borders: Arkansas, Colorado, Florida, Iowa, Kentucky, New Hampshire, New Mexico, Pennsylvania, Rhode Island, West Virginia and Wyoming.
Cross-border Canadian truck freight dropped by 7%. Mexican truck freight also fell by 7%. However, truck freight hauling vehicles in and out of Mexico increased by 6%.
Accounting for all modes of transportation, cross-border freight reached more than $135 billion. That is also the second-highest value on record after dipping by 5% from March’s all-time high.
Compared to April 2021, freight crossing the borders is up 26%.
Vessel and pipeline freight increased in April compared to March by 10% and 9%, respectively.
North Dakota was the only state to experience a year-to-year decrease (minus 9%). More than half of states experienced a drop compared to the previous month. However a cluster of about a dozen states from Utah to Louisiana experienced an increase.
Top commodities decreased across the board except for the No. 1 commodity: mineral fuels; oils and waxes (up 3%). Measuring/testing instruments were hit the hardest with a 13% decrease. LL
Related News