After a slippery few weeks, spot rates find their footing
The number of spot truckload posts on the DAT MembersEdge load board increased last week, and national average spot rates held firm after a soft start to the year.
National average spot van and reefer rates were virtually unchanged compared to the previous week, and an improving manufacturing sector, new-home construction, and spring harvests are creating opportunities for truckers in early February.
National average rates, February
- Van: $2.29 per mile.
- Flatbed: $2.47 per mile.
- Refrigerated: $2.55 per mile.
These are monthly national average spot rates through Feb. 8 and include a calculated fuel surcharge.
Trends we’re watching this week
Van rates find their level
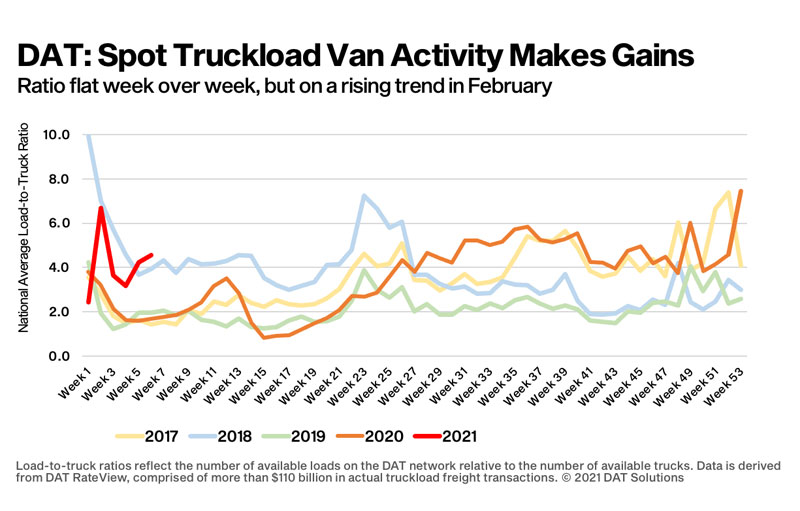
Dry van load post volumes increased 7% last week and posted capacity was virtually unchanged. The average van load-to-truck ratio was 4.5 and trending in the right direction, up from 4.3 the previous week and 3.2 the week before. The spot rate was higher on 58 of DAT’s top 100 van lanes by volume last week.
Manufacturing recovery
The Institute for Supply Management’s manufacturing index was 58.7% in January, not far off its 2½-year high of 60.5% in December. For carriers, the good news is that of the 18 manufacturing industries tracked each month, five of the six biggest – chemicals; metal; transportation equipment; food and beverages; and electronics) – showed moderate to strong growth in January.
Ports in a storm
Port markets across the country are experiencing huge swings in demand for trucks. Volumes in Elizabeth, N.J., increased 7% last week compared to the previous week, and the average outbound rate rose 3 cents to $1.90 a mile. On the West Coast, outbound load volume from Los Angeles dropped 14% week over week; in Ontario, to the east, the decline was 8%. Tighter capacity in both markets lifted the average outbound rate in both markets by 2 cents to $2.35 a mile and $2.43 a mile, respectively.
Catching cold
The number of spot reefer load posts increased 13% last week with very little change in trucks posted. The national average reefer load-to-truck ratio edged higher from 8.6 to 9.9 as a result.
One driver of reefer demand last week: shippers needed temperature-controlled trailers to keep loads from freezing as cold weather hit much of the country last week. The number of loads moved on DAT’s top 72 reefer lanes by volume was up 1.8% compared to the previous week. The average rate was higher on 19 of those lanes, lower on 39 and neutral on 14.
Strawberry fields in Florida
It’s peak growing season for winter strawberries in Florida. Last year, growers shipped 76% of their annual volume between Jan. 25 and March 28 at an average of 72 truckloads per day, according to the USDA. Valentine’s Day was the busiest shipping day.
Flatbeds rising
Flatbed load and equipment posts increased 2% last week, leaving the national average flatbed load-to-truck ratio virtually unchanged at 52.8. Load post volumes in our top 10 flatbed markets increased by just under 1% compared to the previous week. However, the number of loads moved on the top 78 flatbed lanes was up 13.2%, and the average rate was higher or neutral on 59 of those lanes.
Residential construction is helping demand
The U.S. Census Bureau reported a 1% increase in construction spending during the month of December compared to November, but that doesn’t tell the whole story. Residential activity was up 3% month over month while nonresidential construction spending declined 1.7%. For van and flatbed carriers looking for indicators of future demand, building permits were up 30% in December compared to December 2019.
Contract rate dynamics
Contract freight represents around 85% of all truckload freight hauled. Changes in contract rates typically lag spot rates by four to six months, and the extent to which contract rates rise is driven by how long spot rates are at elevated levels.
Shippers put out a lot of request for proposals late in the third quarter and throughout the fourth quarter last year when spot rates were at record highs. Those new 2021 contract rates are now making their way into routing guides – these are the rates that carriers bid on certain shipper lanes and how much capacity they commit to provide throughout the year.
Better contract rates will mean lower spot market rates over time, and high diesel prices can erode margins further. It’s still a good pricing environment for truckers, but the price of fuel and the gap between contract and spot rates bear watching.
National average rates are derived from DAT RateView, a database of $110 billion in actual market transactions each year. Get the latest spot pricing information at DAT.com/Trendlines or take a deeper dive with Market Insights at DAT.com/blog.
Stay safe, and thank you for your hard work.
Check out the Feb. 3, 2021, DAT report for Land Line here.
Related News